22:01 ABC Analysis | ||||||||||||||||||||||||||||||||||||||||||||||||||||||||||||||||||||||||||||||||||||||||||||||||||||||||||||||||||||||||||||||||||||||||||||||||||||||||||||||||||||||||||||||||||||||||||||||||||||||||||||||||
|
The ABC Classification System
The method essenceSanders mentioned that objects (items) in the supply chain are not of equal importance. Some are very important, and others are less important. For example, specialized surgical equipment is important for a hospital, while latex gloves are less important (Sanders, 2013). ABC classification is a ranking system for identifying and grouping items in terms of how useful they are for achieving business goals. The ABC system classifies logistics object according to its size, volume, or cash value added to aggregate category of the firm (inventory or overall costs, turnover, etc.). Classifying inventory based on degree of importance allows us to give priority to important objects and manage those with care. It also prevents us from wasting precious resources on managing objects that are of less importance. In the context of inventory control, typically thousands of independent demand items are held in inventory by a company, especially in manufacturing. However a small percentage is of such a high dollar value to warrant close inventory control.
You see the different values of percentages. They have theoretical values (see Figure 1), but you may specify own values from the ranges mentioned above on the strength of the features of your company.
Figure 1. Graphical representation of ABC groups
Some companies use A, B, C, C- A = 80%, B = 15%, C = 4%, C- = 1% Figure 2 illustrates another variant how percentages are chosen.
Figure 2. Another example for percentages ranges
The steps to conduct an ABC analysis are as follows:
ABC Inventory AnalysisLook at a discount store. You may notice that it stocks different number of different products. Similarly, Wal-Mart normally stocks only a few goods television sets, a somewhat larger number of bicycles or sets of sheets, and hundreds of boxes of soap powder, bottles of shampoo, and AA batteries (Russell and Taylor, 2011). In ABC analysis each class of inventory requires different levels of inventory control. We obey the rule «The higher the value of the inventory, the tighter the control». Thus,
Items of Class A require tight inventory control because of a large percentage of the total dollar value of inventory. These inventory levels should be as low as possible. At the same time, safety stocks are to be minimized or eliminated at all. Of course, to achieve lowest inventory levels a company needs accurate demand forecasts and detailed record keeping. In addition, close attention should be given to purchasing policies and procedures if the inventory items are acquired from outside the firm (Russell and Taylor, 2011). B and C items require less stringent inventory control. Since carrying costs are usually lower for C items, higher inventory levels can sometimes be maintained with larger safety stocks. It may not be necessary to control C items beyond simple observation. In general, A items frequently require a continuous control system, where the inventory level is continuously monitored; a periodic review system with less monitoring will suffice for C items (Russell and Taylor, 2011).
ABC Supplier AnalysisBusiness, which interacts with a large number of suppliers, may faces with significantly different volumes of trade (in money terms) with them. Obviously, inefficient controlling the activities, which involved suppliers with the high trade turnover, brings about significant losses. Thus, company selects those suppliers to priority group (class A) to avoid negative situations, leading to losses. Company's managers can apply heuristic and statistical methods to form that group, i.e. classify suppliers basing on one or more attributes. The volume of trade as an attribute of relations with suppliers can be used in ABC classification method with percentages presented in Table 1.
Table 1 The ABC classification of Suppliers
Suppliers of group "A" are the priority and important. "B" – the less important and "C" – the least important. Each following group has less influence on the procurement results. Therefore, the decision what should be implemented in the interaction with a supplier depends on what group it belong to. Table contains data on trade turnover with suppliers. Suppliers are numbered in the first column of the Table 2.
Table 2 Trade turnover with suppliers
At the beginning of ABC classification we are going to sort suppliers by turnover size. After that we are calculating the percentage for turnover of each supplier. Go to the next step. It is calculating cumulative percentages (see Table 3).
Table 3 Cumulative percentages
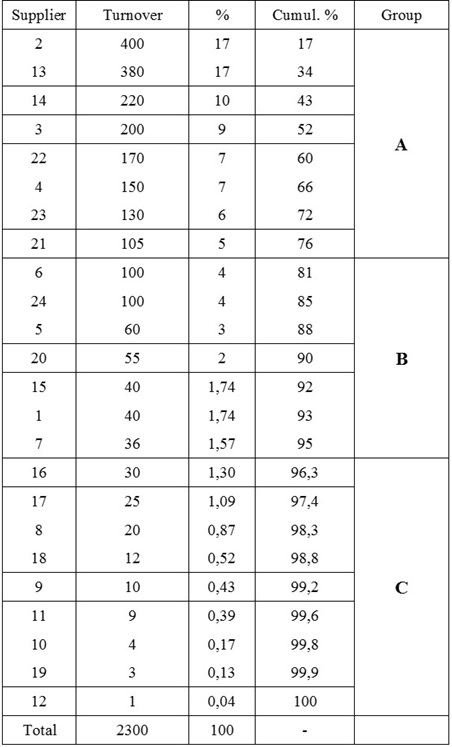
Eventually, we must get the results as Table 4 illustrates. Suppliers are classified in accordance with the selected ranges of percentages for groups A, B, and C. Table 4 The results of ABC supplier analysis
ABC Customer AnalysisThe ABC analysis of customers divides the customers of a company into A, B and C classes. This allocation of the customers into groups is based on margin contribution and sales volume of each customer. Similar to the previous example the biggest customers in term of revenue fall into the category A, whereas the minor customers in term of revenue fall into the category C. The goal of the ABC customer analysis is to determine the customer’s value, on the one hand, to reduce costs for C customers, and, on the other hand, to achieve more profit in the long term through intensive care of the A customers (smartcrm.com).
ABC Analysis: Other Criteria and Fields of ApplicationThere is generalized representation of criteria and reasons of ABC analysis in Table 5, as well as fields, characters and key figures inherent in the application of this classification system in Table 6. Table 5 Different criteria for ABC Analysis
(source: Noche B. ABC-/XYZ Analysis)
Table 6 Fields of ABC Analysis Application
(source: Noche B. ABC-/XYZ Analysis)
References
| ||||||||||||||||||||||||||||||||||||||||||||||||||||||||||||||||||||||||||||||||||||||||||||||||||||||||||||||||||||||||||||||||||||||||||||||||||||||||||||||||||||||||||||||||||||||||||||||||||||||||||||||||
|
|
Modeling. Analysis. Management
Моделирование бизнес-структур
Главная » 2016 Январь 04 » ABC Analysis